We’ve all encountered reckless or oblivious drivers on the highway, and thought, that person is going to get someone killed! Unfortunately, that’s often the case. More than 2 million people are injured and 32,000 killed in motor vehicle crashes each year, according to the CDC. This makes driving one of the most (if not the most) dangerous activities we participate in each day, from a statistical standpoint.

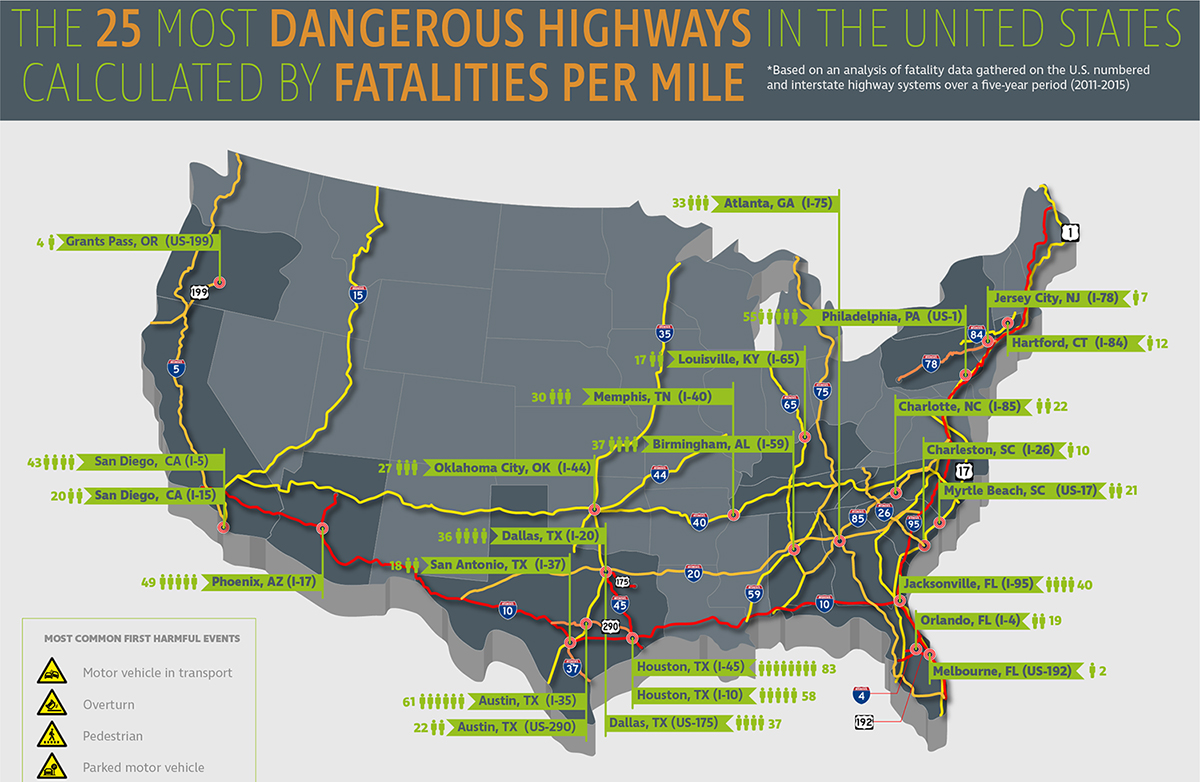
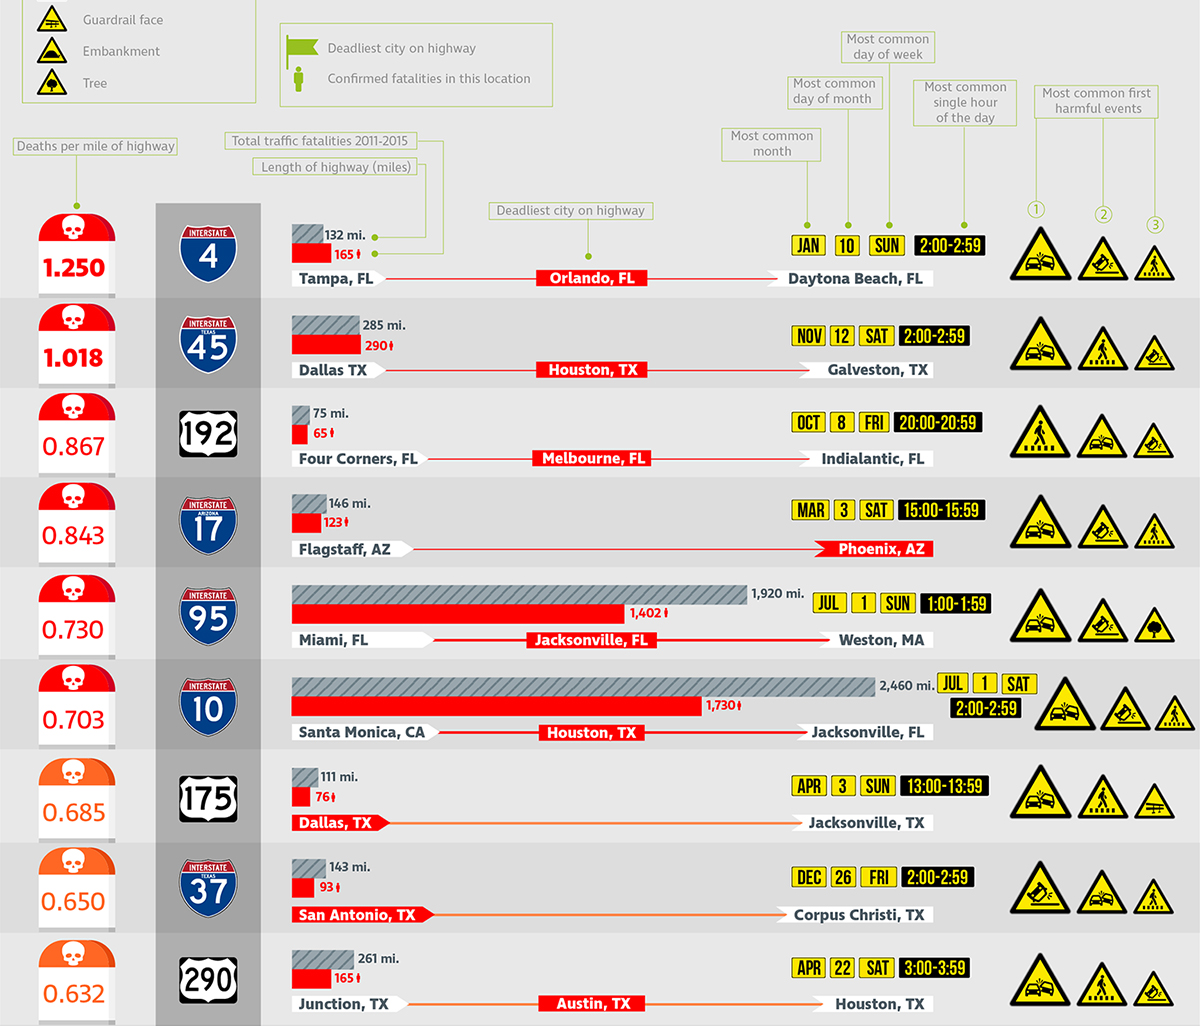
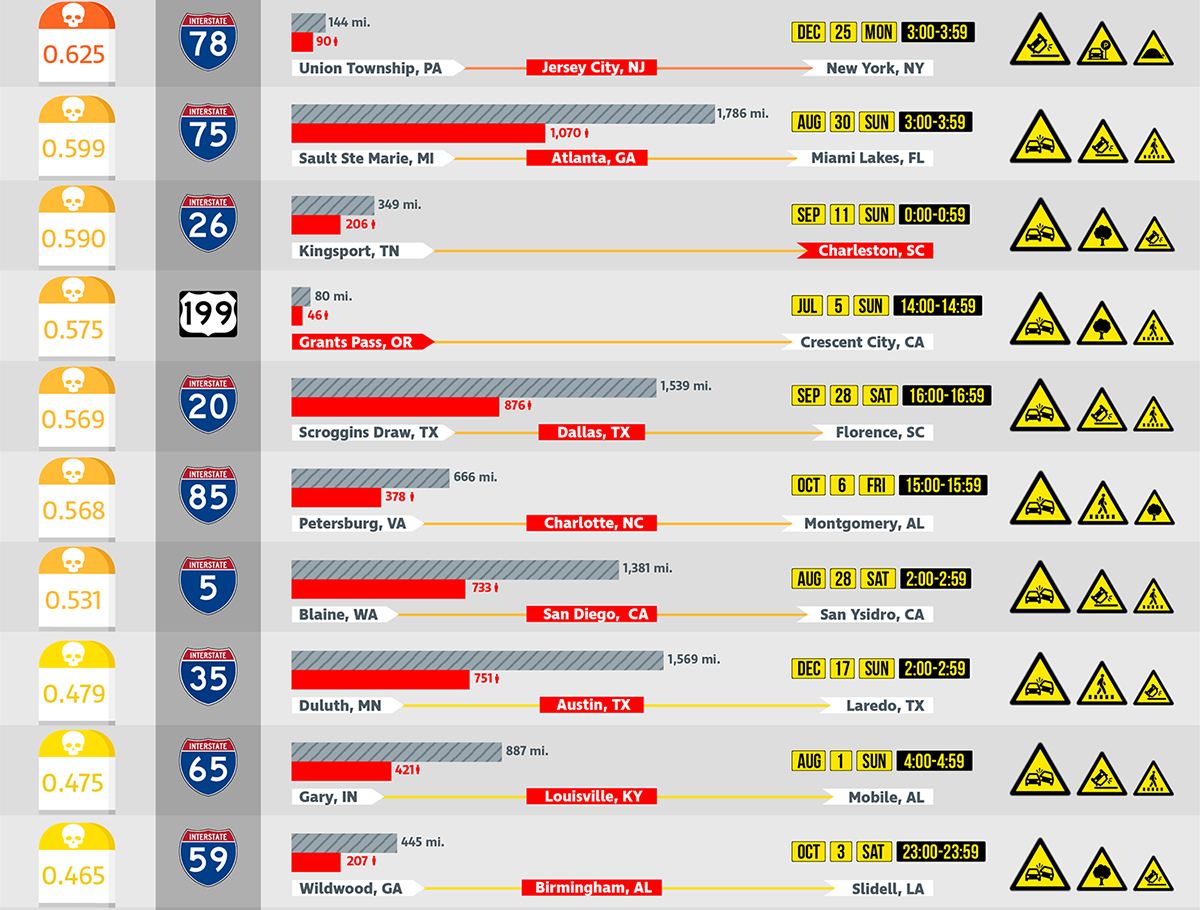
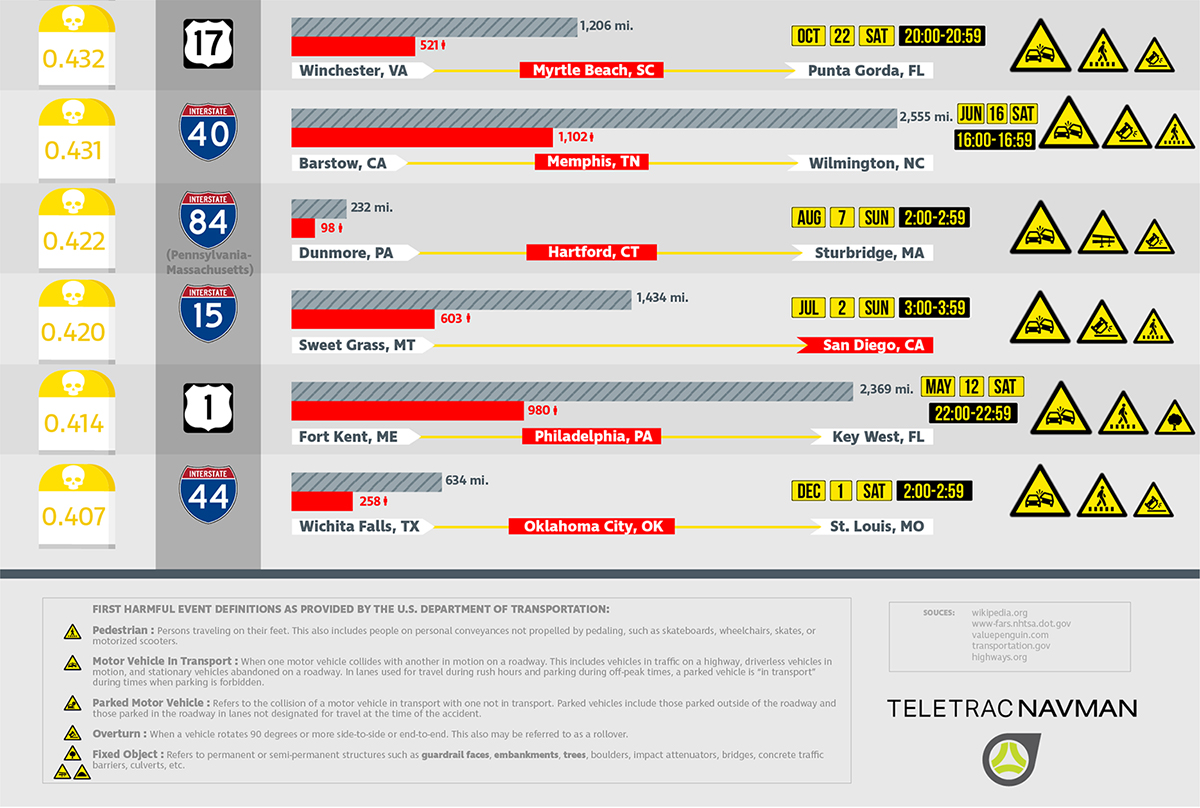
The following infographic from Teletrac Navman shows the most dangerous highways in the United States, based on the average annual number of deaths per mile. It also goes into even more depth, revealing the deadliest city on each highway, most common dates and times of fatalities, and the most common causes of these crashes. There’s a lot of information to be learned here, so check out the most dangerous roads in your region so you can know what to look out for. Click here to download a full-size version of this infographic.
If you’d like to learn more about ways to prepare for dangers on the road, check out these previous articles:
- Infographic: The Dangers of Road Rage
- Tips for Driving on Ice and Snow
- Fuel Expiration: How to Keep Your Bug-Out Vehicle Running