Tornadoes pose a major threat throughout much of the continental U.S., especially in the region known as Tornado Alley. Most of us are aware that these midwest states—specifically Texas, Oklahoma, Kansas, Nebraska, Iowa, and South Dakota—are at a higher risk for this destructive weather phenomenon.

However, the time of year also plays a major role in determining the frequency and severity of tornadoes. Studying both the peak geographic regions and the peak times of year can help us understand the risks of tornadoes, but combining these two data sets paints a much more cohesive picture.
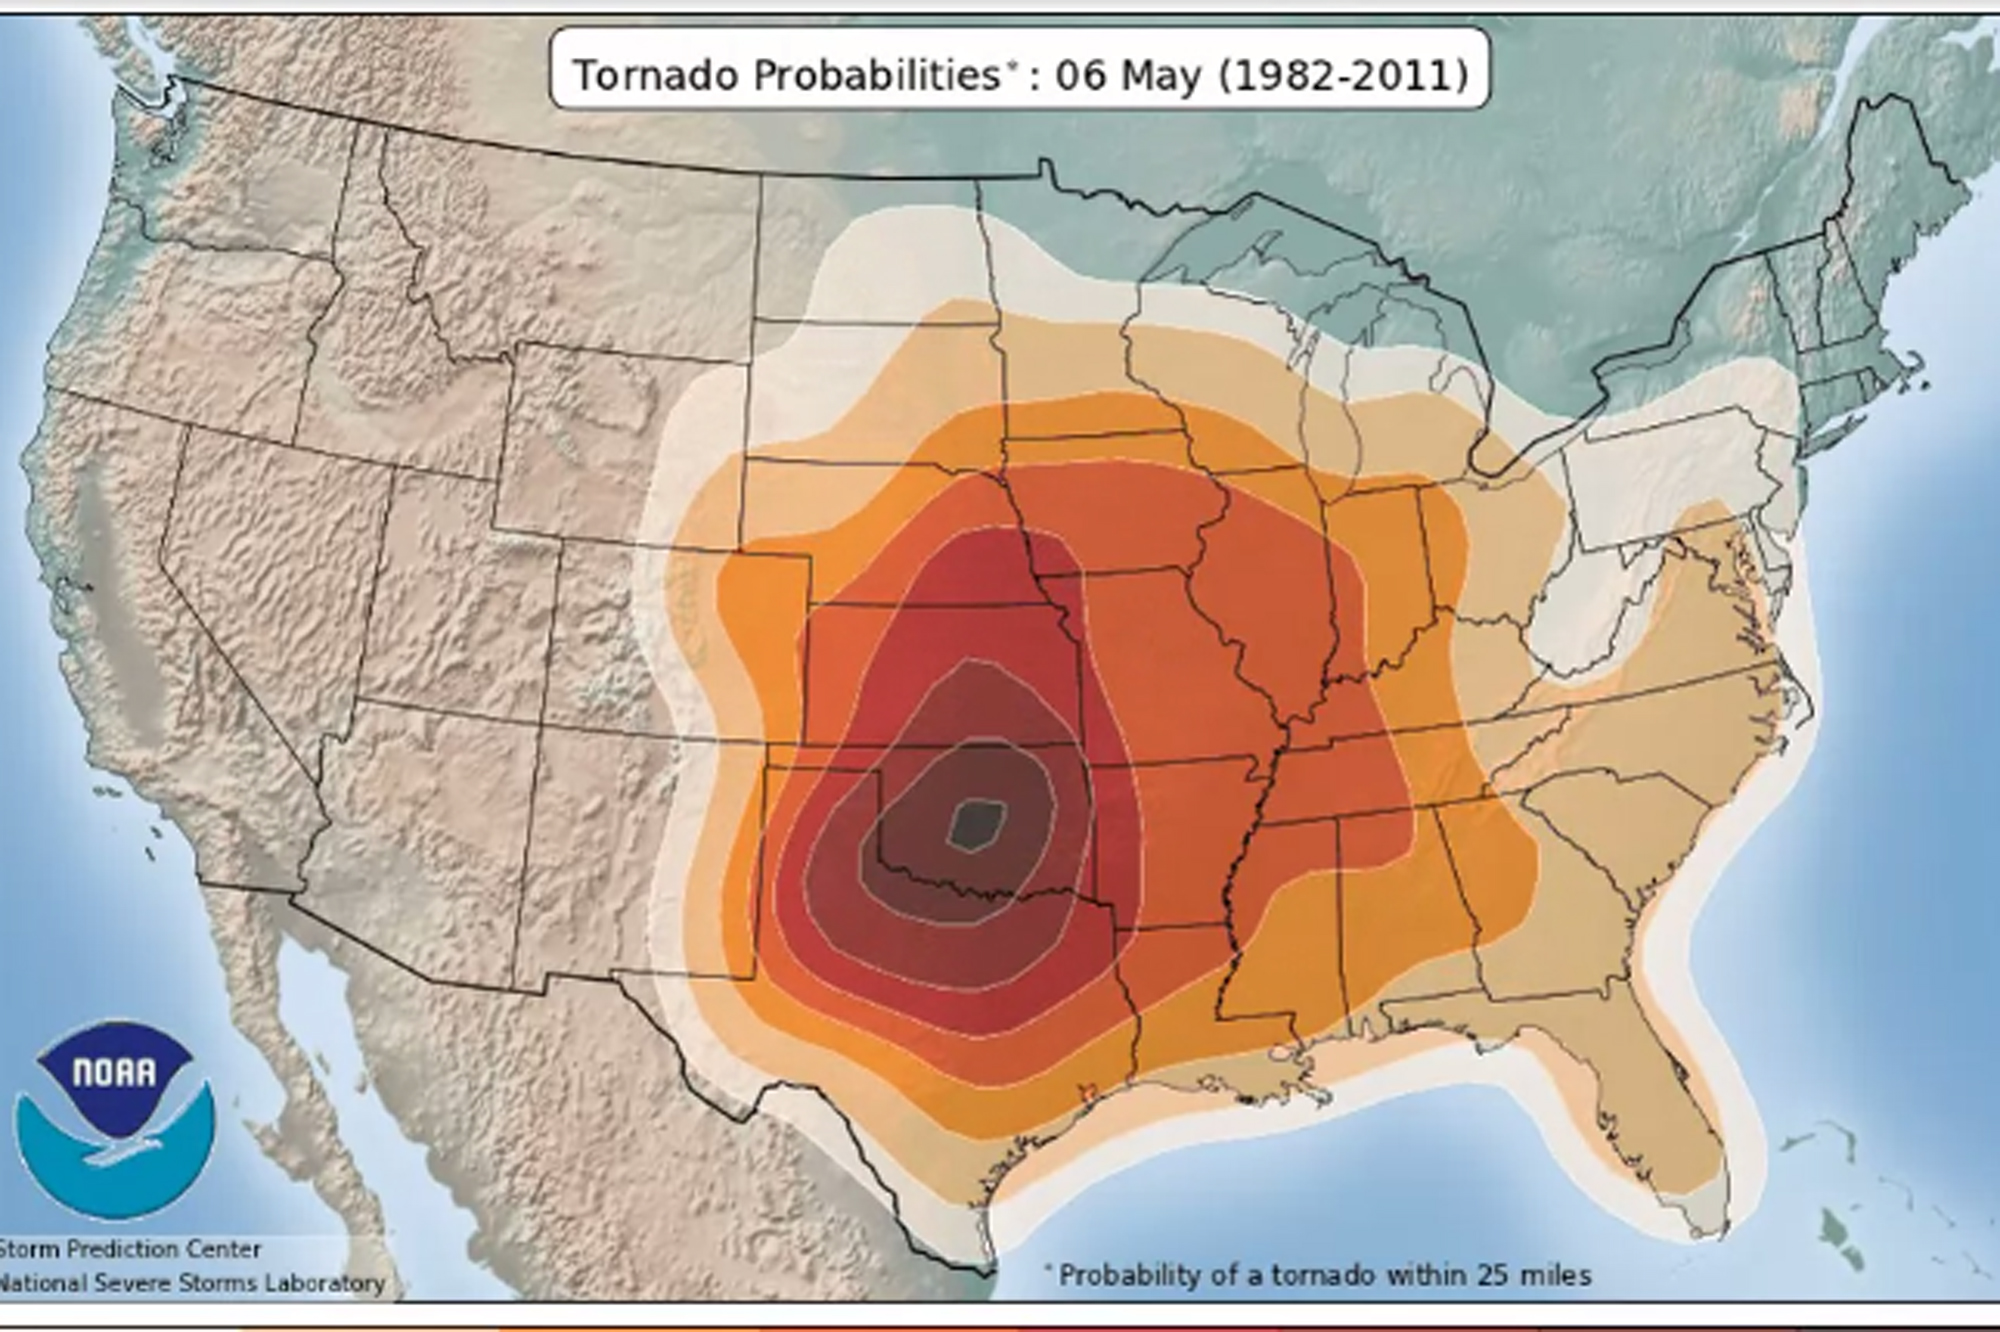
One Reddit user combined daily tornado risk data from the NOAA Storm Prediction Center into an extremely informative 365-day animation. Whether you live in the epicenter of Tornado Alley, or you think you may travel there in the future, this animation provides useful info for preparation and survival.
Click here to view the animated tornado probability map.
